Billing & usage
Where to see your plan, personal activity, and workspace-wide usage.
Your plan
Your plan lives on the Billing tab of your profile. It shows your current plan and, when available, an option to change it. Today accounts are on the Free Plan and paid upgrade options are noted as coming soon.
Your personal usage
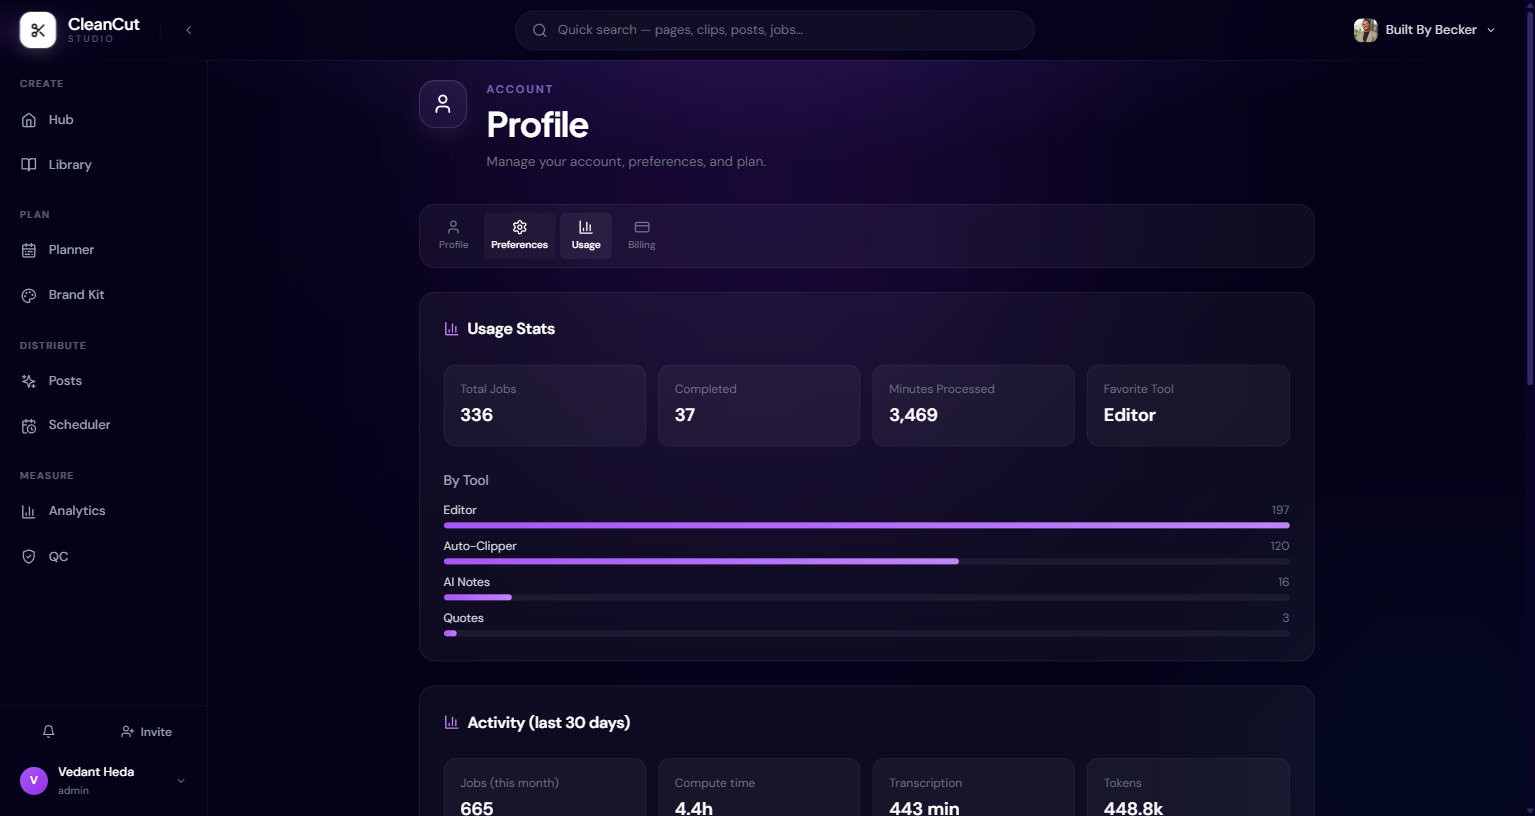
Even without a paid plan, CleanCut tracks what you run so you can see your footprint. The Usage tab on your profile reports your own activity across every workspace you touch.
- Usage Stats — total jobs, completed jobs, minutes processed, and your favorite tool.
- Activity (last 30 days) — month-to-date jobs and compute time, transcription minutes, and token totals.
- Daily activity — a sparkline of jobs per day over the last month.
- Most-used features and recent jobs — with duration and status, including any error class.
This view is scoped to you. For totals across a whole client, an admin uses the workspace-level usage view instead.
Workspace-wide usage (admins)
Workspace settings include a Usage page that aggregates activity across every member of the current workspace. It’s admin-only — editor seats are pointed back to their personal usage on the profile page.
- Month-to-date jobs and compute time for the whole workspace.
- Transcription minutes and token totals.
- A 30-day daily sparkline and a recent-jobs table.
- Soft caps (daily and monthly), shown when configured for the workspace.
If you open workspace usage and see an admin-only message, you don’t have admin on that workspace. Use your profile’s Usage tab to see your own activity instead.
How usage is measured
Usage is recorded per job and rolled up by feature. The main dimensions you’ll see are job counts, compute time (how long processing ran), transcription minutes, and AI tokens consumed by language-model features.
Compute time is displayed in the most readable unit — seconds for short jobs, minutes, or hours for long ones. Token totals are abbreviated (for example k or M) once they grow large. Where workspace soft caps are set, they appear as dollar figures for reference.
If a job shows an error status, its error class is shown alongside it — handy when checking whether a failure was transient or needs attention.