Analytics
Channel stats, per-video performance, demographics, and best posting times.
What Analytics shows
Analytics is where you measure what’s actually working. It brings your connected platforms together so you can see channel-level performance, dig into individual videos, understand who’s watching, and find the times of day your audience shows up.
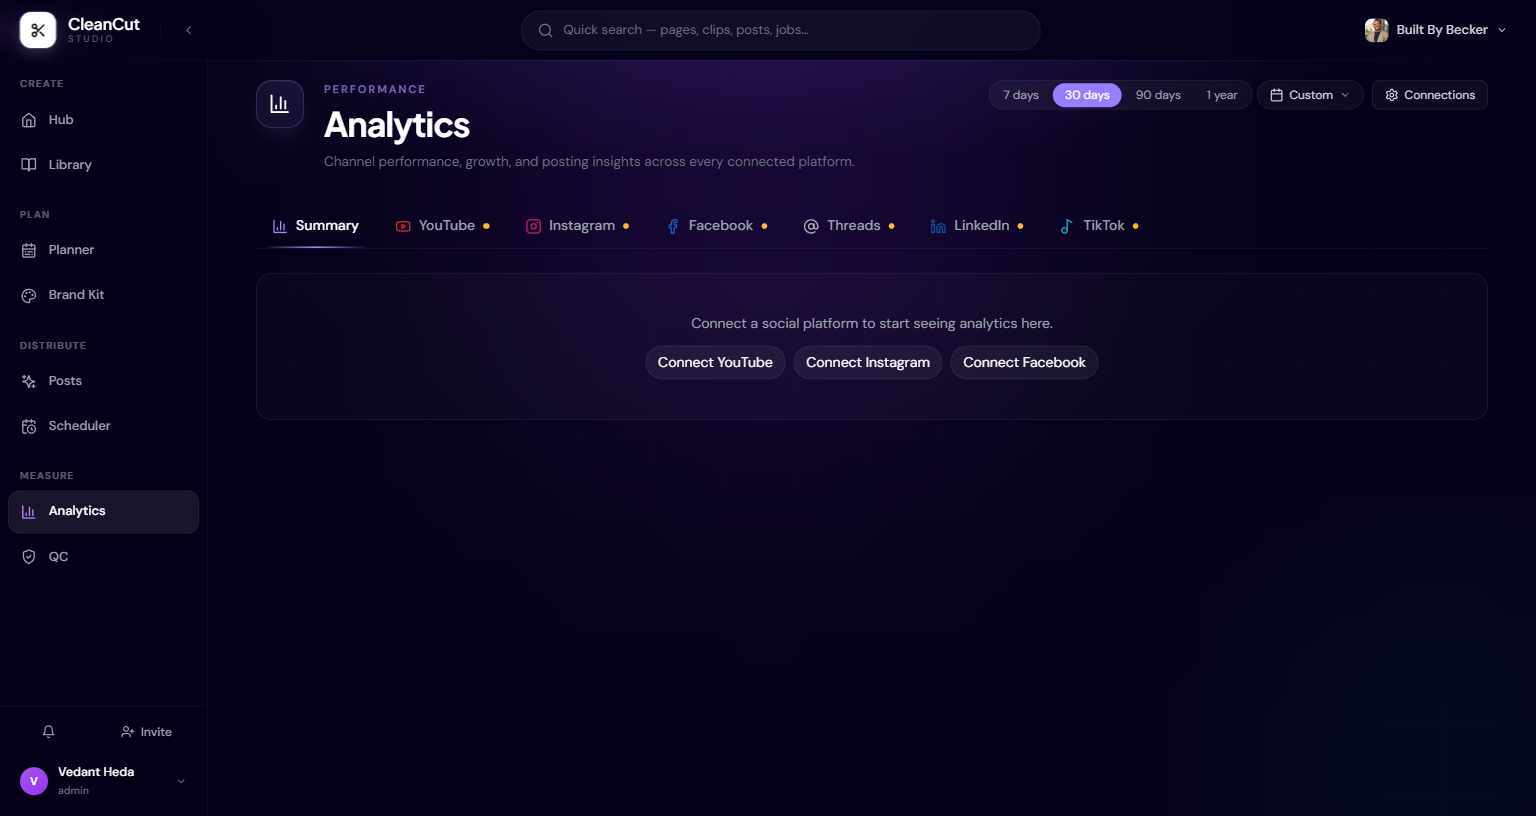
Analytics is workspace-scoped and organised by platform tabs: a Summary overview plus per-platform tabs for YouTube, Instagram, Facebook, Threads, LinkedIn, and TikTok. A tab appears with full data once that platform is connected; until then it shows a connect card.
Channel stats
The YouTube tab opens with a row of overview tiles covering the headline numbers for the selected period. These give you the shape of the channel at a glance before you go deeper.
- Views and Watch time (hours).
- Subscribers gained and Subscribers lost.
- Likes and Comments.
- Average view percentage and average watch minutes per video.
A date range selector at the top controls the window — common periods like 7, 30, or 90 days, plus a custom range — so you can compare a launch week against a quiet month.
Video performance
Below the overview tiles, a video table breaks performance down per video so you can see which pieces carried the period and which underperformed.
- Views per video.
- Watch time (minutes).
- Average view percentage — how far through people get.
- Likes and Comments.
Sort by average view percentage rather than raw views to spot the formats that genuinely hold attention, not just the ones that got an early click.
Demographics and traffic
Past the raw counts, Analytics shows who your audience is and how they find you. Demographics breaks the audience down by country, age, and gender, while traffic sources show how viewers arrived — search, suggested, direct, and the rest.
Together these answer two practical questions: who you’re actually reaching, and which discovery surfaces are doing the heavy lifting — useful for deciding whether to lean into search-friendly titles or community-driven topics.
Best posting times
The best posting times view highlights when your audience is most active across the week. It pairs with a note on how much weight to give the pattern given the data available; per-hour detail appears where the connected platform exposes it.
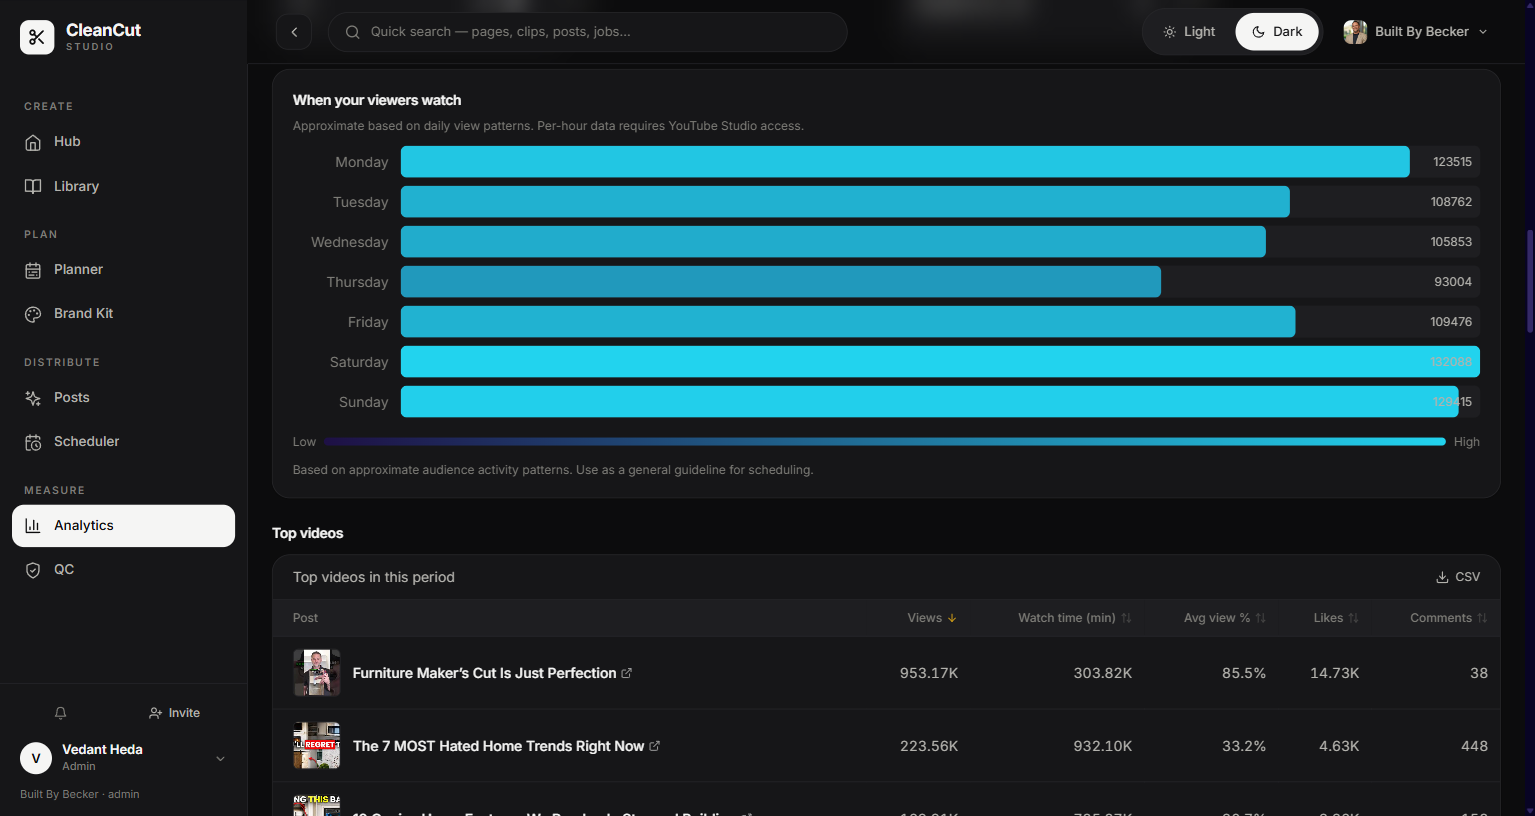
The YouTube best-posting-times heatmap reflects overall audience activity rather than a single date range, so it doesn’t change with the period selector.